
College of Agriculture and Natural Resources
Center for Land Use Education and Research

Land Cover | Analysis Unit | Population Density | Coefficients Set | Change Layer
| Land Cover |
Land cover map is a map of ground features that can be differentiated on a scene (e.g., urban areas, bare land, pasture, etc.).
| National Land Cover Data (NLCD) 2001 | |
 |
 |
Input land cover map must be in a GRID, IMG or TIFF format.
| Analysis Unit |
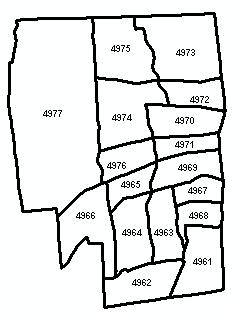
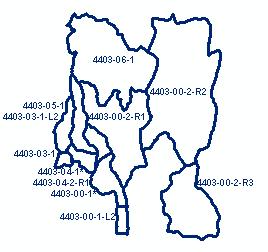
Input zonal dataset (i.e. watershed boundaries, census tracts) over which percent imperviousness will be estimated.
Census Tracts 2000, West Hartford, CT |
Local Watersheds, West Hartford, CT |
 |
 |
Zonal dataset must be in Shapefile format.
| Population Density |
Population Density values must be in people per square miles. The field containing population density values must be part of the Input Zonal Dataset shapefile. |
| Click to obtain Population Data for Census blocks 2000 |
| Click to calculate Population Data for drainage basins or other analysis units |
| Coefficients Set |
There are several Coefficients Sets provided with the ETIS Toolbox: some for Connecticut Changing Landscape (CCL) and National Land Cover Data (NLCD) 2001 datasets. These datasets were calculated using calibration planimetric data from three separate states (CT, MA, and NY) as well as the combinations of them.
A set of Custom Coefficients can be imported to the Toolbox in the form of DBF file table.
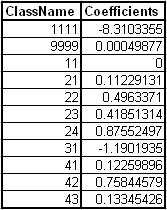 |
The table must have two numeric columns. |
Note: When creating Custom Coefficients table in Excel, make sure that the Coefficients column is in the Number format.
To facilitate the creation of a Custom Coefficients table, a sample DBF table is provided with the ETIS tool, that can be edited directly in ArcMap.
| Change Layer |
ETIS allows to predict the amount of imperviousness in case of the land cover change.
To calculate percent imperviousness for this change a new shapefile need to be created. This shapefile must have one or more polygon features and have a field with the new class values (e.g. New_Class) existing land cover to be changed to.