Prior to the 1960s the significance of Connecticut's marshes was not yet understood. The role of wetlands as natural recyclers of waste and the high volume of plant and animal diversity had not been thoroughly investigated. Peak destruction rates of Connecticut's marshes reached 1 acre per day when coastal development was at its highest (Dreyer & Niering, 1995). Since that time the State of Connecticut Department of Environmental Protection (CT DEP), among other private and public groups, has worked to reclaim approximately 30% of all the tidal wetlands in the state. Changes in government policy, such as the Tidal Wetlands Act of 1969 which made draining, dredging, excavating and filling of marshes government regulated activities also aided in marsh restoration (Dreyer & Niering, 1995).
A large part of the problem in Connecticut marshes has been the presence of an invasive species called Phragmites australis (P. australis). P. australis, also called the common reed, is a tall perennial grass (1.5-4.0m) found primarily in brackish and freshwater wetlands, that forms extensive monocultures (very thick stands which can span hundreds of acres or more) and decreases the plant and animal biodiversity of the marsh. P. australis has been such a problem in Connecticut and in other states that in 1999 the Executive Order 13112 on Invasive Species was passed encouraging the control of P. australis on Federal lands. Eradicating P. australis is expensive and numerous methods have been employed in Connecticut. One of the goals of my thesis project has been to find a method to classify P. australis using remotely sensed imagery in order to be able to provide an estimate of the progress of eradication efforts and to come up with a historical analysis of P. australis in the wetland regions along the mouth of the Connecticut river. My primary research advisor is Dr. Martha Gilmore at Wesleyan University and I am also receiving help from Sandy Prisloe, Emily Wilson and Dr. Daniel Civco at the University of Connecticut through the geospatial fellow position.

Above:Phragmites australis Tops
Remote sensing is a powerful tool in the monitoring vegetation dynamics because it allows for characterization on a global scale. There are several characteristics of vegetation that allow it to be monitored by remote sensing such as the absorption in the red and blue portion of the visible spectrum (which creates the green reflectance~.55µm), a strong near-infrared reflectance which correlates to overall biomass of the plant(~.72-.90µm), differences in the mid-infrared region of the spectrum which correlate to changes in the moisture content of the plant (~.9-2.0µm), and other unique spectral signatures due to parameters such as leaf shape, size, plant height, density, etc. In layman’s terms, examining the spectral signature of P. australis allows us to monitor its growth patterns throughout the year because we can see changes in the chlorophyll content and overall biomass of the species spectrally as it grows.
As you can see from the graph above, different types of vegetation have different spectral signatures. Spectral signatures are also affected by factors such as water content which is evident in the dry grass/green grass spectra.
The first
step in my thesis project was to determine if P. australis has
spectral characteristics that are unique enough to distinguish it from
surrounding marsh vegetation. Initially, to understand the spectral characteristics
of P. australis a more sensitive instrument was employed that collected
hyperspectral data and later this knowledge is applied to Landsat data
which has less sensitivity. The vegetation graph above is an example of
hyperspectral data. Hyperspectral data provides a much more intimate portrait
of P. australis, compared to Landsat data, because it has thousands
of bands (regions which it looks at the spectral signature) compared to
Landsat which has seven bands. One of the drawbacks of the hyperspectral
data collection is that it was collected in situ (at the site)
so it was time consuming and required an expensive instrument. Two graphs
below show P. australis compared to another marsh
species in hyperspectral data (A)
and what this hyperspectral data would look like in Landsat (B). The lines overlain on the hyperspectral
graph A represent the band
width for each Landsat band. Landsat data would actually be an average
of the data in the given band width, so the second graph B shows what the signature would actually
look like in Landsat. (Note that Band 6 and the Panchromatic bands of
Landsat are not included because they were not used in the study and are
not generally used to study vegetation dynamics).
A

B
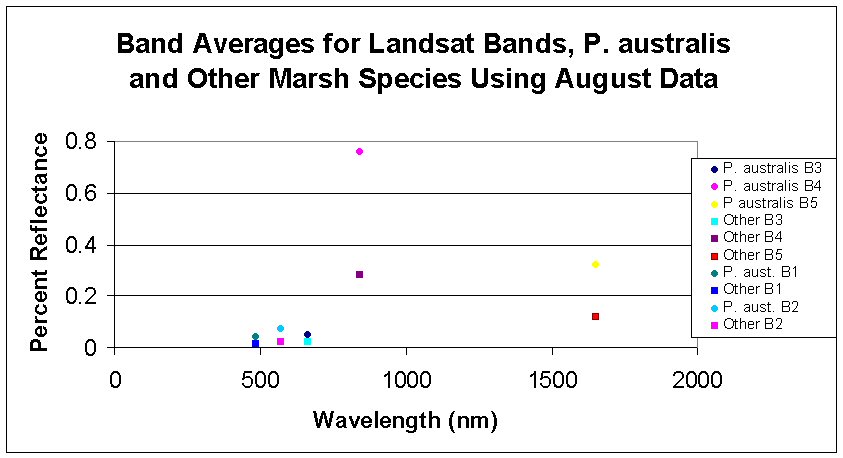
Preliminary analysis of the hyperspectral data concludes that: (1) the greatest consistent contrast between the spectral signature P. australis and surrounding marsh vegetation occurs in the 0.63-0.69μm and the 0.76-0.90μm regions which correspond to Band 3 and Band 4 in Landsat data (note that the graph above is not a temporal representation), (2) contrasts between P. australis and other marsh species in the 0.63-0.69 and 0.76-0.90μm range in the hyperspectral data are visible in Landsat data,(2) during July, August, and September the spectral signature of P. australis is more easily distinguished from other marsh species compared to earlier months in the spring and later months in the winter, and (3) the spectral signature of the purple bloom of the P. australis, which appears in late July-early August, aides in distinguishing P. australis from other species due sharp contrasts in slope between 0.63-0.90μm region, also (4) P. australis is lacking in green reflectance when flowering (August), and (5) 1.5-1.75μm and 2.035-2.080μm regions, which are sensitive to the moisture content of plants, were not as helpful in distinguishing between P. australis and other marsh species as Bands 3 and 4.
It is not surprising that the 0.63-0.69 and 0.76-0.90μm regions are useful in distinguishing between P. australis and other marsh species because these regions correspond to the chlorophyll content of the plant and the biomass of the plants. The 0.63-0.69μm (Band 3 in Landsat) region measures the visible red portion of the electromagnetic spectrum and provides information on the relative chlorophyll content. High values in Band 3 correlate to low chlorophyll concentrations are seen in the hyperspectral data during April, May, and November when the P. australis has just begun to grow (April, May) or is beginning to die out (November). The 0.76-0.90μm (Band 4) region is sensitive to the infrared reflectance of plant cells and will increase as the number of plant cells increases thus giving a relative measure of biomass. Band 4 begins increasing in the hyperspectral data from May and peaks in July for P. australis and slowly begins to decrease again during August, September and November as the growth rate declines. The graphs below show changes in Band 3 and Band 4 of the hyperspectral data for P. australis and other marsh species.
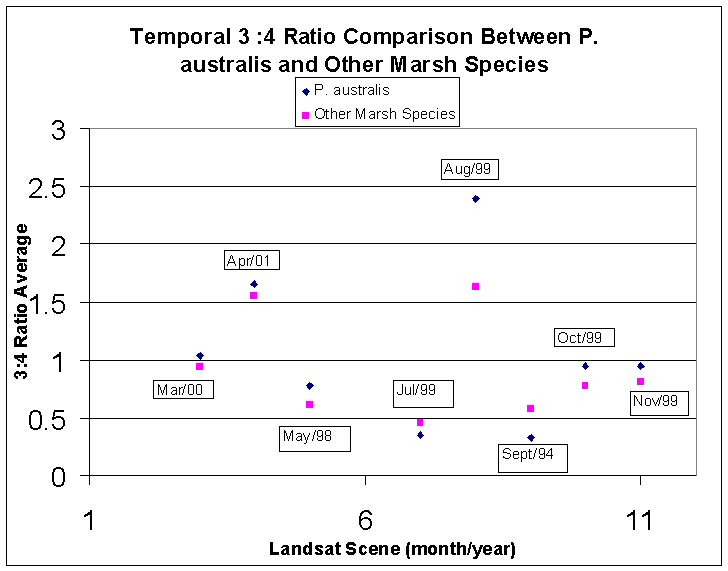
The various dates of the Landsat scenes were chosen to cover the phonological cycle of P. australis and also based on availability. The graph above makes several illustrations; (1) that there is a consistent difference in the 3:4 ratio values of P. australis and other marsh species, (2) this difference is greater in some months than others, manly August and (3) the P. australis has a higher 3:4 ratio during Mar/Apr/May/Aug/Oct/Nov. and a lower 3:4 ratio during Jul/Sept. Although the difference between the 3:4 ratios of P. australis and other marsh species is small it can be used to classify P. australis using Landsat data.
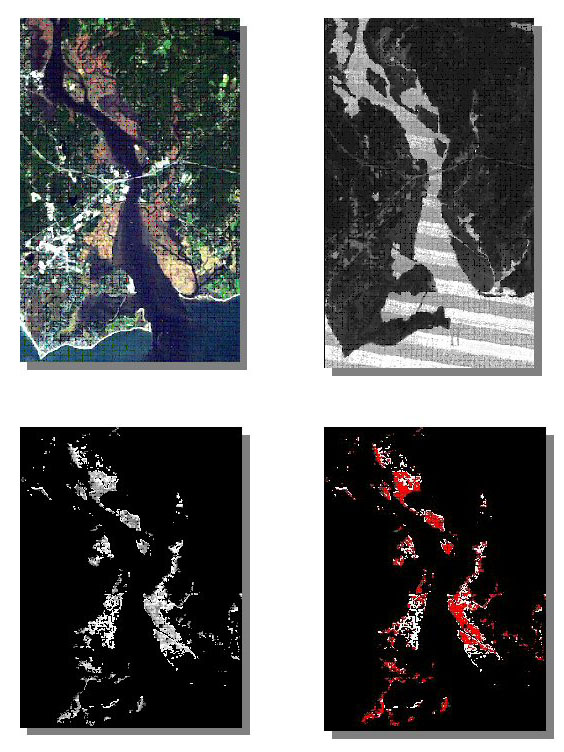
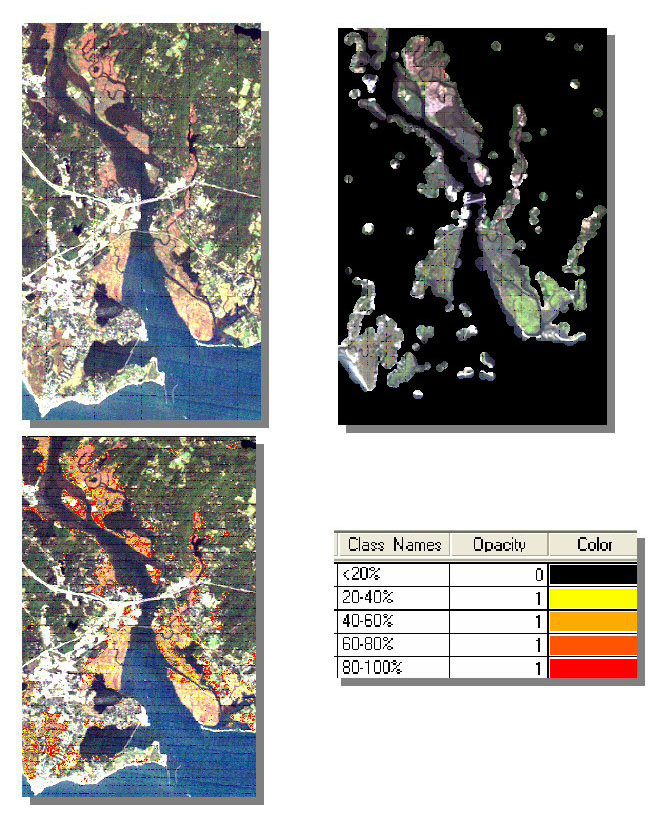
Using the knowledge gathered from the hyperspetral data, as well as some other analysis methods, two remote sensing software programs were used to classify P. australis in Landsat images along the mouth of the Connecticut River. The Environment for Visualizing Images (ENVI) software was used to perform an analysis involving the 3:4 ratios of the Landsat Bands. ERDAS Imagine software was used to perform a Subpixel Classification of P. australis in the same area using the same Landsat images. Subpixel simply refers to the fact that sometimes the object of interest in a pixel (unit components of the image; one Landsat pixel is 30m x 30m) may not occupy 100% of the image and therefore the image is “mixed.”The ERDAS Subpixel Classifier allows you to train the program to recognize your material of interest, in this case P. australis, and classify the amount of P. australis in the scene and also the percentage.To test the accuracy of both methods the results were compared to a 1994 study conducted by Sandy Prisloe and Nells Barrett using GIS Analysis to classify P. australis. Both methods show the same trend in P. australis growth/decline and both methods classify somewhat conservatively with the largest error margin (~10% using ERDAS) being in a class of less than 20% P. australis but with increasingly less error in classes with higher percentages of P. australis. The results are promising for people who wish to classify P. australis using Landsat imagery (TM, ETM+) without the added hassle of hyperspectral analysis. The images below are of September 1994, the same year that the GIS study was performed. The first images are of the 3:4 classification results in ENVI. Image 1 is a true color image of the study area, image 2 shows the results of a 3:4 band ratio, image 3 shows a wetland mask (a mask is used to isolate the study area) and image 4 shows the P. australis classified shown in red and the grey areas area the areas of the mask which were not detected by the classification method. The second image set shows the subpixel classification results for the same image. The first image is a true color, the second image shows the wetland mask, and the third image shows the results of the subpixel classification.
Below I have listed some websites useful for finding out more about P. australis, wetlands, and remote sensing in general. I hope you enjoy them!
For a closer look at hyperspectral data visit JPL’s spectral library and search the database for different spectra:
For a really excellent tutorial on the basics of remote sensing:
rst.gsfc.nasa.gov/AppC/C1.html
For more remote sensing websites because you just can’t get enough, Dr. Martha Gilmore at Wesleyan Univ. has an excellent page of websites for her remote sensing class:
mgilmore.web.wesleyan.edu/wescourses/2001s/ees326/01/remlinks.htm
For more on coastal marsh projects the following two websites are both interesting:
www.edc.uri.edu/restoration/html/intro/salt.html
glcf.umiacs.umd.edu/data/coastalMarsh/data.html
For recent images in remote sensing:
For more information on ERDAS and ENVI
gis.leica-geosystems.com/default.asp
Dreyer, G.; Niering, W. Tidal Marshes of Long Island Sound: Ecology, History and Restoration. The Connecticut College Arboretum. Bulletin No. 34, December 1994.
Contact
Cary Chadwick
Geospatial Training Program Coordinator
cary.chadwick@uconn.edu
(860) 345-5216